728x90
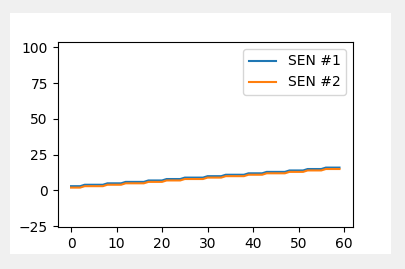
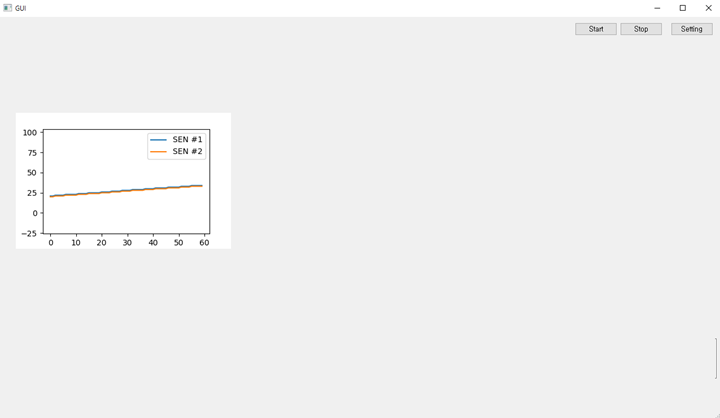
QT라이브러리 이용해서 GUI만들고 거기에 그래프 삽입
기타 설명 소스 주석 참고
- 소스코드
class MyWindow(QMainWindow, form_class):

    def __init__(self):
        super().__init__()
        self.setupUi(self)
        # ... 생략

    def create_Graph(self):
        self.fig1 = plt.Figure()
        self.canvas1 = FigureCanvasQTAgg(self.fig1)
        self.y1 = np.arange(-20, 100, 2) # y축 크기
        self.x1 = np.arange(0, SIZE, 1) # x축 크기
        # x축 크기와 y축 크기는 같아야 함 ex) 60 x 60
        self.graphLayout1.addWidget(self.canvas1)
        # QT 그래프 레이아웃에 위젯으로 canvas추가
        self.ax1 = self.fig1.add_subplot(1, 1, 1)

        self.line1, = self.ax1.plot(self.x1, self.y1, label='SENSOR #1') # 그래프 #1 데이터
        self.line2, = self.ax1.plot(self.x1, self.y1, label='SENSOR #2') # 그래프 #2 데이터

		labels_data = ["SEN #1", "SEN #2"] # 라벨붙이기
        self.ax1.legend(labels_data) # 범례 넣기

        # 그래프 그림 그릴 애니메이션
		self.ani1 = animation.FuncAnimation(self.fig1, self.animate1, init_func=self.initPlot)
        self.ani2 = animation.FuncAnimation(self.fig1, self.animate2, init_func=self.initPlot)
		self.canvas1.draw()
        self.show()

	def initPlot(self):
    	# 초기화
        self.line1.set_ydata(cvs.datalist1)
        self.line2.set_ydata(cvs.datalist2)
        return self.line1,

    def animate1(self, i):
        self.line1.set_ydata(cvs.datalist1) # 그래프 1번꺼 초기화
		return self.line1,

    def animate2(self, i):
        self.line2.set_ydata(cvs.datalist2) # 그래프 2번꺼 초기화
	    return self.line2,
- 결과


728x90
'IT > Python' 카테고리의 다른 글
| [Python] Hex <-> Float, Double, Ascii, Decimal 변환 (0) | 2021.05.12 |
|---|---|
| [파이썬] pyCharm에서 pip로 라이브러리 연결하기 (0) | 2021.02.24 |
| [Python] MQTT 통신 (0) | 2021.02.02 |
| [Python] QT Dialog 간 데이터 전달 (0) | 2021.02.02 |
| [Python] Serial 통신(읽기/쓰기), 사용가능한 시리얼 포트 검색 (0) | 2021.02.02 |

댓글